Loading document...
| Technology | Energy generated (MWh/year) | Carbon saved (tCO₂e / year) | |
|---|---|---|---|
| Electricity | Heat | ||
| Onshore Wind - 2 lowest cost 10MW sites | 54,520 | 23,444 | |
| Tidal Current | 18,180 | 7,817 | |
| Tidal Lagoons | 90,460 | 38,898 | |
| Wave | 21,760 | 9,357 | |
| Biomass Domestic | 44,150 | 10,150 | |
| Biomass Small scale | 21,024 | 4,833 | |
| Biomass Medium scale | 15,768 | 3,625 | |
| Biomass Large scale | 36,792 | 8,458 | |
| AD | 1,434 | 1,205 | 903 |
| Solar PV | 298 | 128 | |
| Solar Thermal | 740 | 220 | |
| Small Wind Domestic | 1,752 | 753 | |
| Small Wind Commercial | 2,190 | 942 | |
| Heat Pumps (air & ground) | 56,261 | 4,870 | |
| Small CHP (<50 kWe) | 14,995 | 24,192 | 2,140 |
| District Heating | 17,800 | 4,092 | |
| Small Hydro | 2,208 | 949 |
The renewable technology options described in this report could make a significant beneficial difference to the greenhouse gas emissions of the Island. The carbon benefit for each measure has been assessed, with assumptions regarding avoided use of existing energy supplies. Offshore wind has not been included as it is assumed to generate electricity that is exported to the UK and therefore has no impact on the carbon footprint of the Isle of Man. Overall, this carbon assessment highlights the importance large scale electricity generation as the most significant options to deliver the greatest carbon savings. Domestic and large scale biomass also provide large benefits.
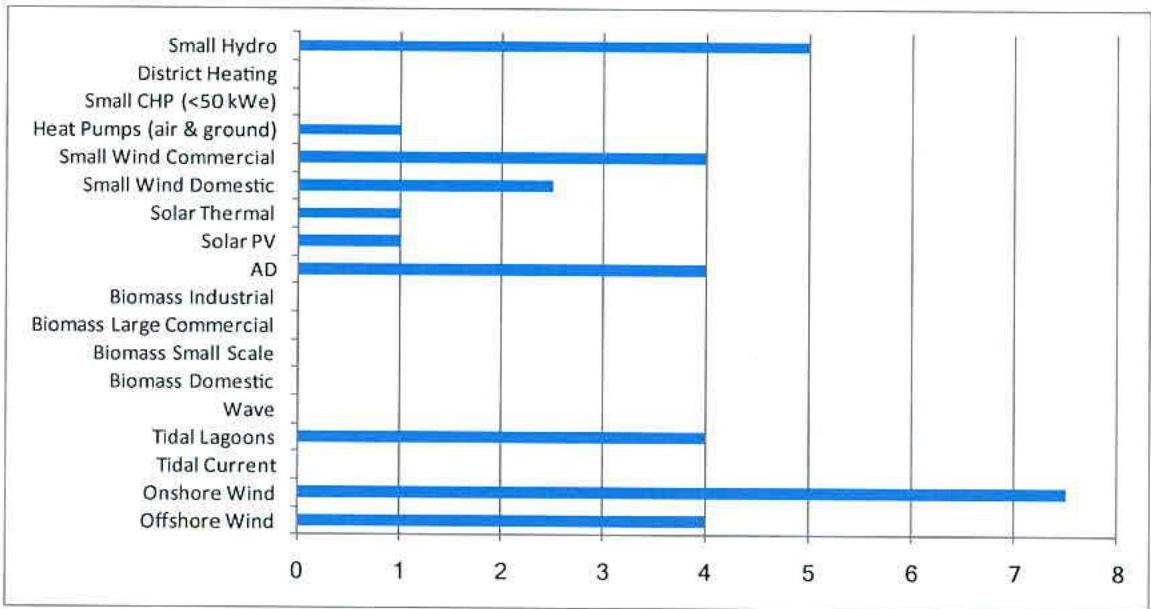
Visual impact is an area of public concern for developments in general and for wind farms in particular. Hence planning regulations often include visual impact as a criterion that will influence local plans and the assessment of specific planning applications. With regards Marine developments, the IoM Government has employed an Officer to progress Marine Spatial Planning for IoM Territorial Waters. A methodology for ranking the measures according to visual impact has been developed, which ranks technologies from zero to nine². The highest impact technologies are offshore, onshore and small scale wind, AD and small hydro, shown below.
² Note: the visual impact scale is specific to the methodology applied for this issue, such that each technology is scored between zero and three for its visual impact and for the sensitivity of the locations where it would be most likely to be deployed, and the scores are multiplied together. The collation of all issues in the MCA normalises them all to a scale of 1 to 6.
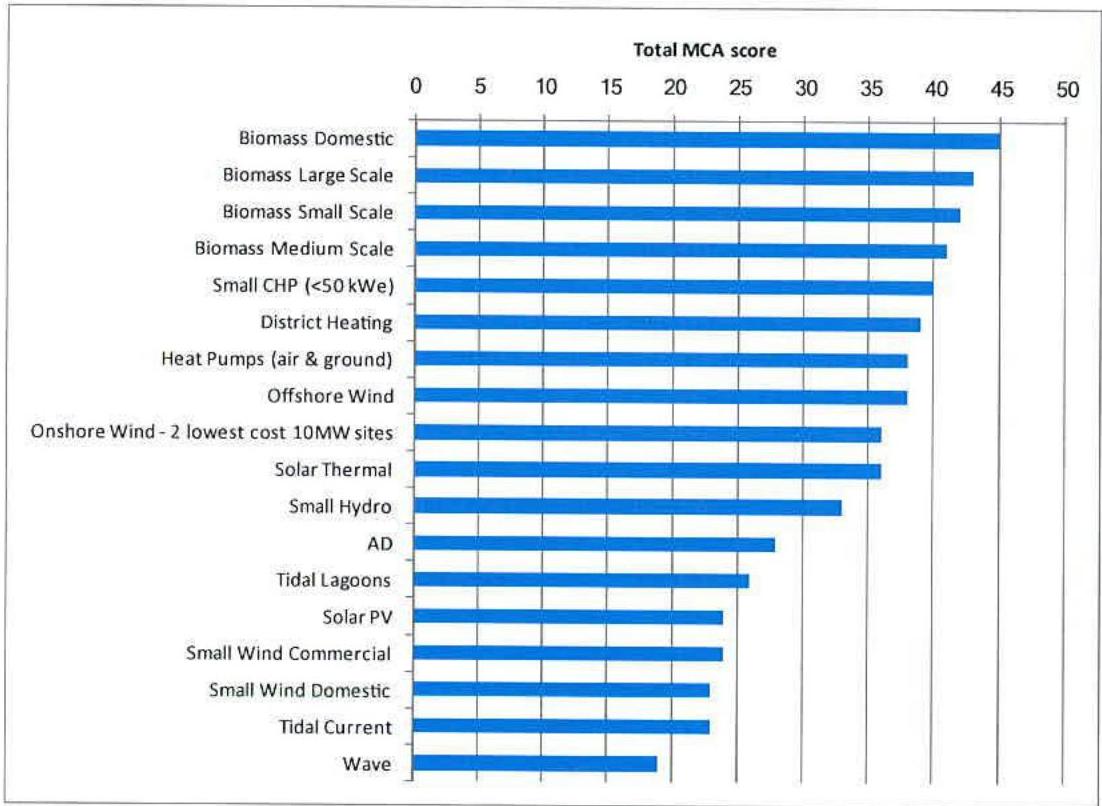
A powerful tool to enable the ranking of technology options is the use of Multi Criteria Analysis (MCA). The purpose of the MCA is to bring together each of the technology attributes, including economics, carbon barriers and visual impact in a way that gives an appropriate ranking to each criterion. MCA involves the systematic assessment of each technology against a set of criteria against a quantitative scale. The criteria are then weighted according to perceived importance, and the scores combined to give an overall technology score, on a scale from zero to 50.
Overall, it is clear that biomass applications score the best in this assessment. Small non-domestic CHP schemes, the district heating option identified in this study and heat pumps (both ASHP and GSHP) perform well. Offshore and onshore wind achieve the next highest scores.
Solar thermal and small hydro score next, although are very modest in terms of energy generated, and hence carbon saved. AD is medium to low ranking. Of the remainder, small scale wind and solar PV score less well primarily because of their costs and more modest deployment potential. Marine generation technologies also score low, but because of their costs and technology immaturity.
It is important to note that of the technologies shown in the above figure, we consider tidal current, tidal marine and wave to be below TRL9, i.e. not at a stage for commercial deployment.
The purpose of the scenarios is to develop different views of the future. The potential role and development of each renewable energy technology is then assessed in each of these futures. This provides an understanding how renewable energy could develop under different views of what the future might hold. Four scenarios have been developed, corresponding to a matrix of low (current) and high energy prices and low (current) and high take up of energy efficiency measures on the Isle of Man. The scenarios are shown below:
| Energy Efficiency | Energy Prices | |
|---|---|---|
| Low | High | |
| High | ORANGE • Low financial incentive for energy efficiency as the savings and case for investment is weak. • Instead regulations or public opinion drive demand down • Consumer bills lowest • Energy costs are an incentive for inward investment • Lowest market incentive for RE, requires most Govt incentive for RE | BLUE • Strongest market incentive for energy efficiency • Backed by regulations • Lowest energy demand • Strong case for efficiency and renewable solutions. • Lowest energy imports • Renewable energy generation for export |
| Low | PURPLE • Low efficiency buildings • Low efficiency appliances • Highest energy demand • Weak case for efficiency and renewable solutions. • Building in long term high energy use in new homes etc. • Highest energy imports (100%). | YELLOW • Market incentive ineffective to overcome barriers to EE • Lack of investment as other priorities attract funds • Consumer bills highest • Energy costs are a disincentive for inward investment • Highest incentive for RE – but low investment • Would need financial support |
As a reference to future energy price scenarios, we take the latest UK Department of Energy and Climate Change (DECC) price projections. These forecasts are produced annually and take information from current studies as well as representing the best view from DECC internal modelling. In the latest issue, June 2010³, real gas prices for the central case have an annual growth rate of 1.2% to 2020, whereas the corresponding increase in oil price is about 1.4% per annum. In our methodology we take these prices as representative of the low energy price scenario – i.e. the current position. The high energy price scenario would need to be materially different and we consider that the DECC high price scenario is appropriate for this. In the DECC high price scenario the annual rate of increase of oil and gas prices is around 4% in the next few years, reducing to a rate of increase of 3% by 2020.
Similarly energy efficiency is assumed not to fall from current levels, hence low energy efficiency is intended to represent the current situation, where high levels of efficiency are not widespread buildings, appliances or other energy using equipment. In this outcome energy efficiency will continue to improve but at a slow, gradual, rate.
³ http://www.decc.gov.uk/assets/decc/Statistics/Projections/67-updated-emissions-projections-june-2010.pdf
High energy efficiency is a much more rapid improvement. This could be driven by regulation (e.g. much more stringent building regulations) or through better financial returns (due to high energy prices or incentives). In this outcome energy demand falls, which will reduce opportunities for some of the renewable energy technologies. In our appraisal of domestic energy efficiency savings, we identified that in principle up to 9MWh of annual energy for space heating could be saved from current levels of around 12MWh. As an indication, our high energy efficiency scenarios would correspond to the realisation of these benefits in over 20% of private households.
The assessment has looked at how each of the technologies would be favoured, or otherwise, in each scenario. In conclusion it is found that biomass and onshore wind are very resilient to each scenario, so would be attractive in a wide range of future conditions. Offshore wind is favoured in high energy price scenarios. On the heat side, district heating, heat pumps and solar thermal fair reasonably well, especially in the high energy prices high energy efficiency scenario.
The adoption of renewables on the Island, if they are more expensive than conventional alternatives, will put an upward pressure on energy prices. This impact has been modelled and it is found that for electricity, onshore wind has the smallest impact on energy costs for the Island, at an average price increase of about 0.4p/kWh for the lowest cost onshore wind projects (assuming overground cabling but excluding other connection costs and the increase to MEA operational costs necessary to manage the effects of intermittent generation). However, it is important to note that we have derived a range of costs for onshore wind, depending on location and method of connection (underground or overground cabling). At a 10% discount rate costs vary between 7.7p/kWh to 13.7p/kWh. Our simplified model indicates that for every 1p/kWh cost increase for 20MW of onshore wind generation the average electricity price would increase by 0.12p/kWh, so it is clear that if more expensive onshore wind projects were developed then the impact on electricity prices could be more significant.
The other large centralised generating options have a significant impact on the economy, most noticeably the tidal options, because of their size and high levelised costs. The smaller projects implemented by individual consumers have a much smaller impact on the Island cost of energy, principally because of their modest size. With the exception of small CHP though, the unit cost for the consumer/developer is substantially increased over the current grid supply costs. In general, the benefit from avoided gas imports for the electricity measures is more than outweighed by the higher overall technology cost.
For heat, the non-domestic biomass and CHP deliver a net energy cost saving to the Island and to individual consumers. For the other options the total Island cost is relatively modest, but this generally reflects the small scale of deployment of these measures.
Investment in renewable energy is likely to create direct jobs as well as indirect jobs across the entire supply chain of the renewable industry including environmental monitoring, development design, commissioning and procurement, manufacturing, installation, project management, transport and delivery and operations and maintenance. In order to determine the potential job generation from each technology option a renewable supply chain gap analysis carried out by the UK Department of Trade and Industry (DTI) was drawn upon and modified for the Isle of Man. The results are shown below.
| Technology | Total jobs | Direct jobs | Indirect jobs |
|---|---|---|---|
| Offshore Wind | n.a. | n.a. | n.a. |
| Onshore Wind (2 most favoured 10MW farms) | 5.1 | 3.7 | 1.4 |
| Tidal Current | 1.5 | 1.1 | 0.4 |
| Tidal Lagoons | 14.0 | 9.9 | 4.1 |
| Wave | 10.5 | 7.4 | 3.1 |
| Biomass Domestic | 72.8 | 40.4 | 31.5 |
| Biomass Small scale | 23.1 | 12.8 | 10.0 |
| Biomass Medium scale | 18.0 | 9.2 | 8.7 |
A qualitative review of the supply chain capability for the Isle of Man for supporting the renewable technologies suggests that jobs created or retained would mainly be related to:
Investment in renewable energy requires an investable project. This is true of community and commercial developments. To fund a renewable or low carbon energy project requires:
This wider consideration of funding reflects the fact that all capital funding relies on a business case which in turn depends on the operating costs and revenues. In other words the project needs to be fundable in order to attract funding. Potential ways for community involvement in new renewable projects have been examined and case studies that are believed to have potential interest for the Isle of Man have been provided.
The case studies show some of the potential roles and funding opportunities for community bodies. There are also a wide range of roles for a public body in the funding and delivery of renewable energy. The table below summarises these:
| Technology | Total jobs | Direct jobs | Indirect jobs |
|---|---|---|---|
| Biomass Large scale | 18.0 | 9.2 | 8.7 |
| AD (EFW) | 0.6 | 0.0 | 0.0 |
| Solar PV | 0.2 | 0.0 | 0.0 |
| Solar Thermal | 50.7 | 27.5 | 23.2 |
| Small Wind Domestic | 0.3 | 0.0 | 0.0 |
| Small Wind Commercial | 0.3 | 0.0 | 0.0 |
| Heat Pumps (air & ground) | na | ||
| Small CHP (<50 kWe) | na | ||
| District Heating | na | ||
| Small Hydro | 0.8 | 0.0 | 0.0 |
| Total | 216 | 123 | 93 |
| Stage | Role |
|---|---|
| Fuel Inputs | Providing fuel (e.g. food waste) |
| Providing Land (suited to wind farms) | |
| Providing Buildings (for solar installations) | |
| Capital Funding | Investment |
| Access to grants targeted at the key technologies | |
| Gearing from credit rating | |
| Community Infrastructure Levy | |
| Energy Outputs | Long term energy supply contracts |
The role of a public body in an individual project will vary greatly and the public body may have more than one role. Hence the role of public bodies can only be specified in more detail when the details of the projects are known.
This study has assessed the potential for energy efficiency, renewable and low carbon energy generation on the Isle of Man. The following conclusions have been reached:
Further fiscal or economic, regulatory, information or behaviour change measures need to be established to enable the IoM government to realise its aims and objectives. Transparent quantified targets should also be set to help the government and citizens to monitor progress to targets.
There are great opportunities for improved energy efficiency and unit costs lower than the current retail price of energy. Specifically in the domestic sector these include loft insulation, cavity wall insulation, draught proofing, improved heating controls and improved lighting. These measures are cheaper than current energy generation and new renewables so should be pursued as a policy priority.
There are likely to be significant energy savings opportunities within the public non-domestic building stock, but the opportunities have not been characterised for specific buildings. It would be cost-effective to commission a detailed survey of public buildings, possibly making use of thermal imaging.
Further work should be undertaken to determine opportunities for energy savings within the commercial and industrial sectors. It has not been possible to assess the opportunities as part of this study.
The energy infrastructure is well positioned to meet the current energy needs of the Island's population in a safe and economic manner, through its gas and diesel electricity generating plant and plans to extend the natural gas network, although there is heavy reliance on imported fossil fuels. There is no short to medium term need to extend either the gas or electricity interconnector capacities to meet Island needs.
Biomass technologies represent the best renewable option overall, for scales ranging from domestic through to large scale applications, using indigenous resources in the first instance. It is the cheapest heat option; although for domestic consumers would be significantly higher than conventional gas generation. It has the lowest barriers to deployment and without the visual impact concerns that affect some other technologies. The carbon saved could be over $20,000\mathrm{tCO}_{2}/\mathrm{y}$ so it offers potential to make a significant contribution to the Island's climate change ambitions. The technology is fairly robust to future energy price and energy efficiency scenarios and has the potential to generate jobs on the Isle of Man. More widespread development of biomass should be a priority for the Isle of Man Government. This should focus initially on non domestic applications but potentially also extend to domestic uses, for which some capital subsidy may be necessary.
There is potential for a district heating scheme making use of heat from the Richmond Hill EfW plant and serving the Isle of Man Business Park, Spring Valley Trading Estate and involving reuse of the former Ballakinnish Nurseries glasshouse complex. The Isle of Man Government should engage with affected business and the plant operator to determine the appetite for such a project. The cost of heat could be comparable with conventional sources, but with high capital expenditure. There may be a role for the Isle of Man Government in facilitating the development process and providing support for the capital requirements.
Domestic ground and air source heat pumps could also play a major part in meeting future Island energy needs, although the greatest barrier is cost. Some degree of capital subsidy, grant or loan may be appropriate to contribute to the cost of establishing these technologies in the domestic sector, which can amount to approaching £10k per application. It could be taken forward on a trial basis.
Solar thermal should not be pursued as a policy priority due to its high cost relative to other heat generation options.
Onshore wind should be pursued as a priority option for meeting short and longer term domestic renewable energy targets. It is the cheapest renewable electricity generating option and its increased cost relative to conventional CCGT is relatively small. It can deliver large amounts of energy, save significant carbon dioxide emissions and reduce the need for gas imports. The greatest barrier is public opposition and the Isle of Man Government should engage with local communities on the prospects for onshore wind generation.
The Island has significant offshore wind generation resource and four possible zones for large wind farms have been identified. These projects could generate large amounts of electricity (between 1,000GWh and 3,500GWh per year) although would only be viable under a scenario of direct connection to the UK in which Renewable Obligation certificates or similar are earned.
There is potential for additional small hydro generation, although the amount of electricity that could be generated would be small, and the cost of generation is around three times that of CCGT. It is recommended that the Isle of Man Government does not pursue small hydro as part of its renewable energy strategy.
Wave, tidal lagoon and tidal current technologies are at development or demonstration stages and as a consequence any application for the Isle of Man would be risky and expensive in economic terms. It is not recommended that the Isle of Man Government pursues any of these technologies as part of its medium term energy strategy. There could be benefits to the Island economy from the support of research and development projects on small scale, with the objective of establishing new clean tech enterprises that could benefit the Island through longer term exports or eventual commercial application on the Island. However, this would need to be viewed as a research project and not one that would provide a cost effective means of meeting short or medium term energy needs.
Small scale wind and solar PV are expensive options that have not scored well in the overall assessment. As well as price there are barriers over visual impact and consequently it is judged that the potential of these technologies to meet Island energy needs and contribute to cutting emissions is relatively small.
Small scale CHP applied to non-domestic buildings offer the potential for a cost effective way to cut carbon emissions and fossil fuel imports through the more efficient use of natural gas. Unit cost to consumers would be comparable with retail costs, although a barrier would be the capital investment cost. The Isle of Man Government could consider funding measures to support the supply and take-up of these technologies, possibly as part of a trial.
The potential for anaerobic digestion has been reviewed and the most promising option identified. It is judged that it could be cost effective, however, it would be on a very small scale relative to other technologies, and there would be concerns over its technical success (given previous experience on the Island). The multi criteria analysis ranks this technology low and it is considered that it should not form a significant part of a long term energy strategy.
In this study the potential for improved energy efficiency and the application of renewable and low carbon technologies on the Isle of Man has been systematically reviewed. The assessment has considered the state of technology readiness and the resources available on and around the Island to identify candidate projects for each. These have then been assessed to determine their costs, potential carbon benefits, contribution to improved energy security and the extent to which there are barriers or visual impact concerns associated with them. The impact that the technologies could have on employment and energy prices have then been considered, and examples provided of how local communities may benefit from the involvement in such projects. On the basis of this work we have identified those measures that we recommend should form part of a long term energy strategy for the Island, and those that should not. For technologies that it is recommended that the Isle of Man pursues, the type of support that may be applicable has been identified. It is recommended that the Isle of Man develops a long term energy strategy focusing on the most promising measures that are identified in the above conclusions.
Copyright in submitted documents remains with their authors. Request removal